Supplemental material 5
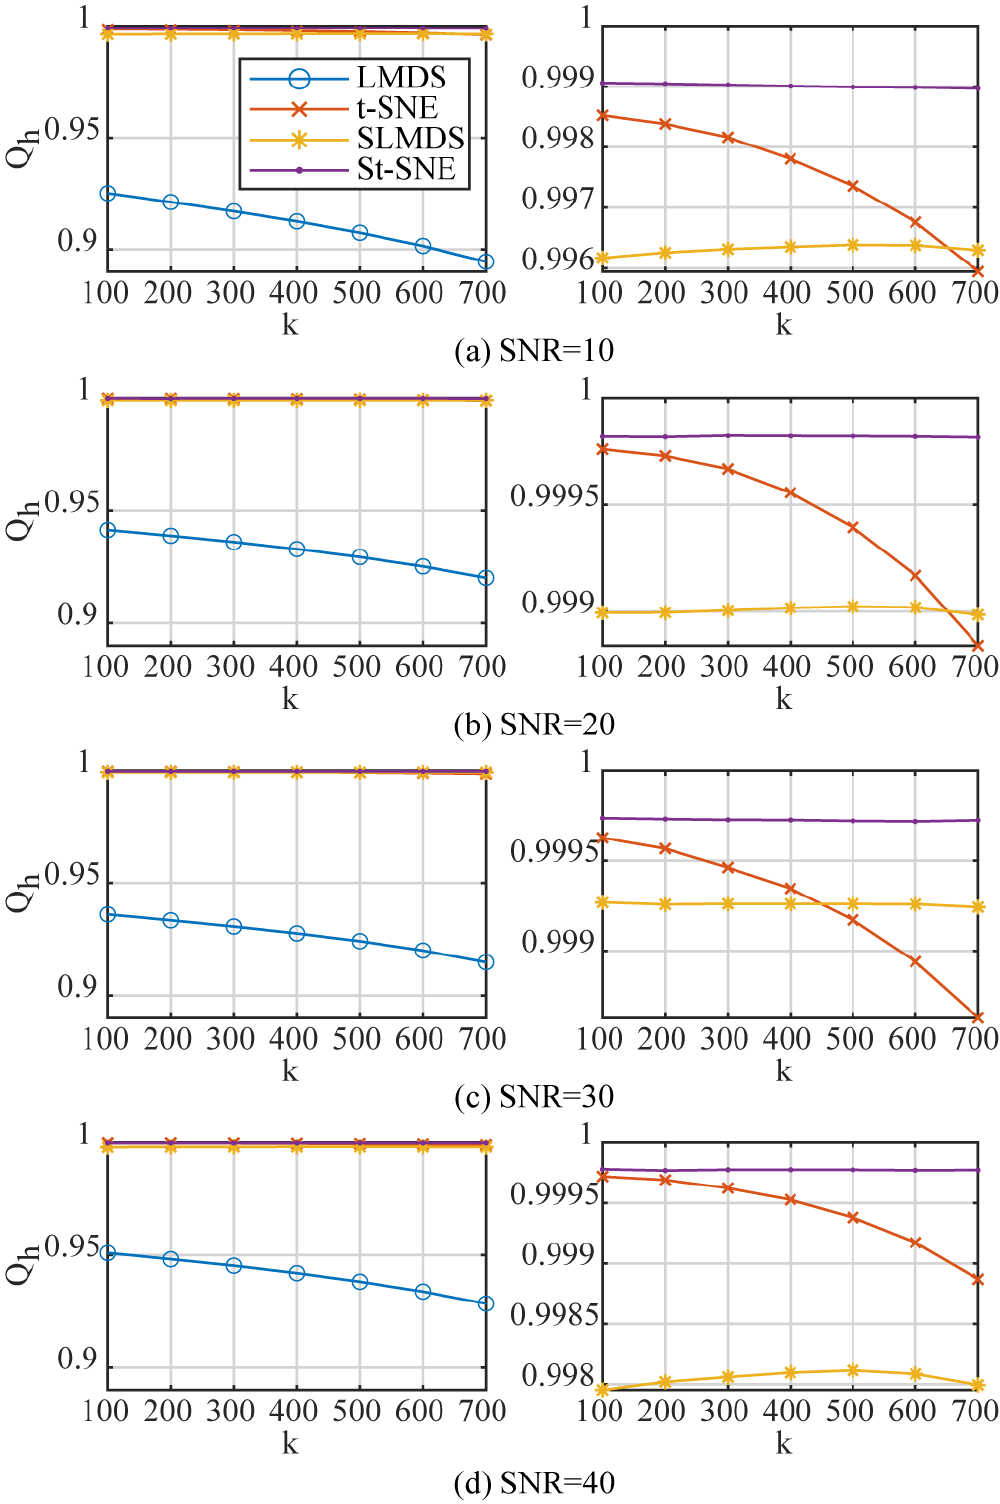
Extended results of the Neighborhood hit (Q_h) for data sets with different k-values and signal-to-noise ratio (SNR) values ranging from 10 to 40, where Gaussian noise has been added. The graphs in the right column show the cluttered area (Q_h is approx. 1) for the graphs in the left column. Overall, note that the Q_h-values are higher for higher SNR values. Further note that the Q_h-values of SDR are always higher than those of the corresponding DR.