Comparison of DR and HD-SDR on HAR data with dimensions pre-selected using PCA
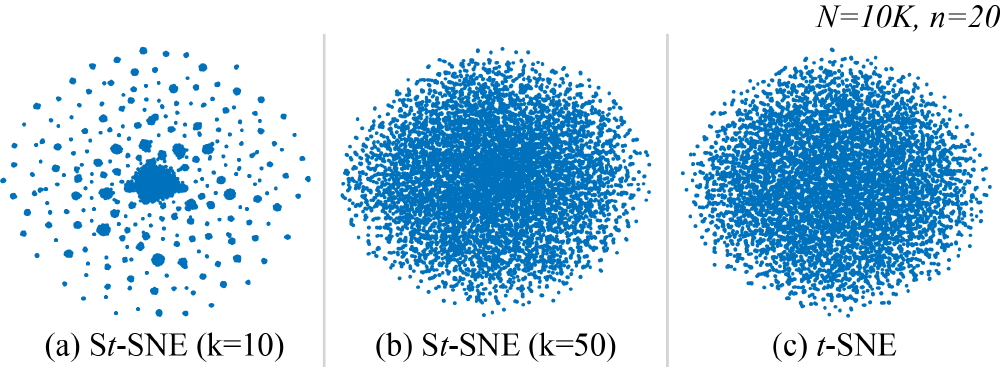
Results of DR and SDR with varying k-values for sharpening. The synthetic data set consists of 10K randomly generated samples in 20D. Note that St-SNE shows oversegmented clusters using k=10, while (b) shows a single cluster as in (c) when using k=50.