Effect of different hyperparameters using Gaussian synthetic data
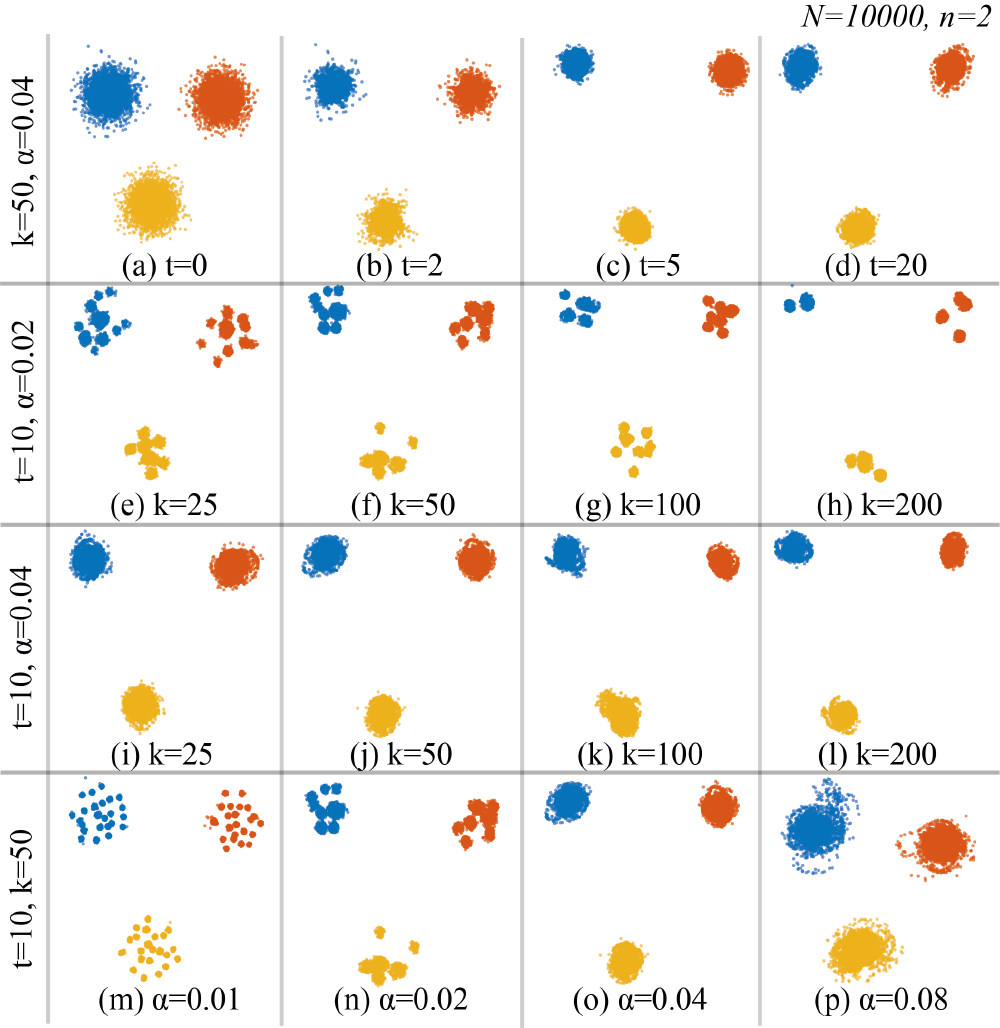
Effects of parameters used in LGC. 2D Gaussian data with 10K observations and three clusters (a) are used to show the effects of the number of iterations (T) as shown in (a)–(d), number of nearest neighbors (k) in (e)–(l), and learning rate (α) in (m)–(p). Points are color-coded based on their ground-truth labels. The cluster borders become fuzzy when using a too high T, as shown in (d). k and α both contribute to the degree of segmentation of the clusters; without choosing an appropriate α, k may not significantly affect the segmentation, as shown in rows (e)–(h) and (i)–(l). Note that α uses a fixed range of [0,1].